Crescimento Exponencial, mas sem o Corona
Uma família de funções que aparece em variados contextos é a exponencial:
\[f(x) = ab^x\]
Se diferenciarmos em particular a função \(b^x\) vamos ter \(b^x \log_e b\). Se \(b>1\) a função cresce, se for menor, decresce. A constante \(e\) é a única que equaliza a função e a derivada.
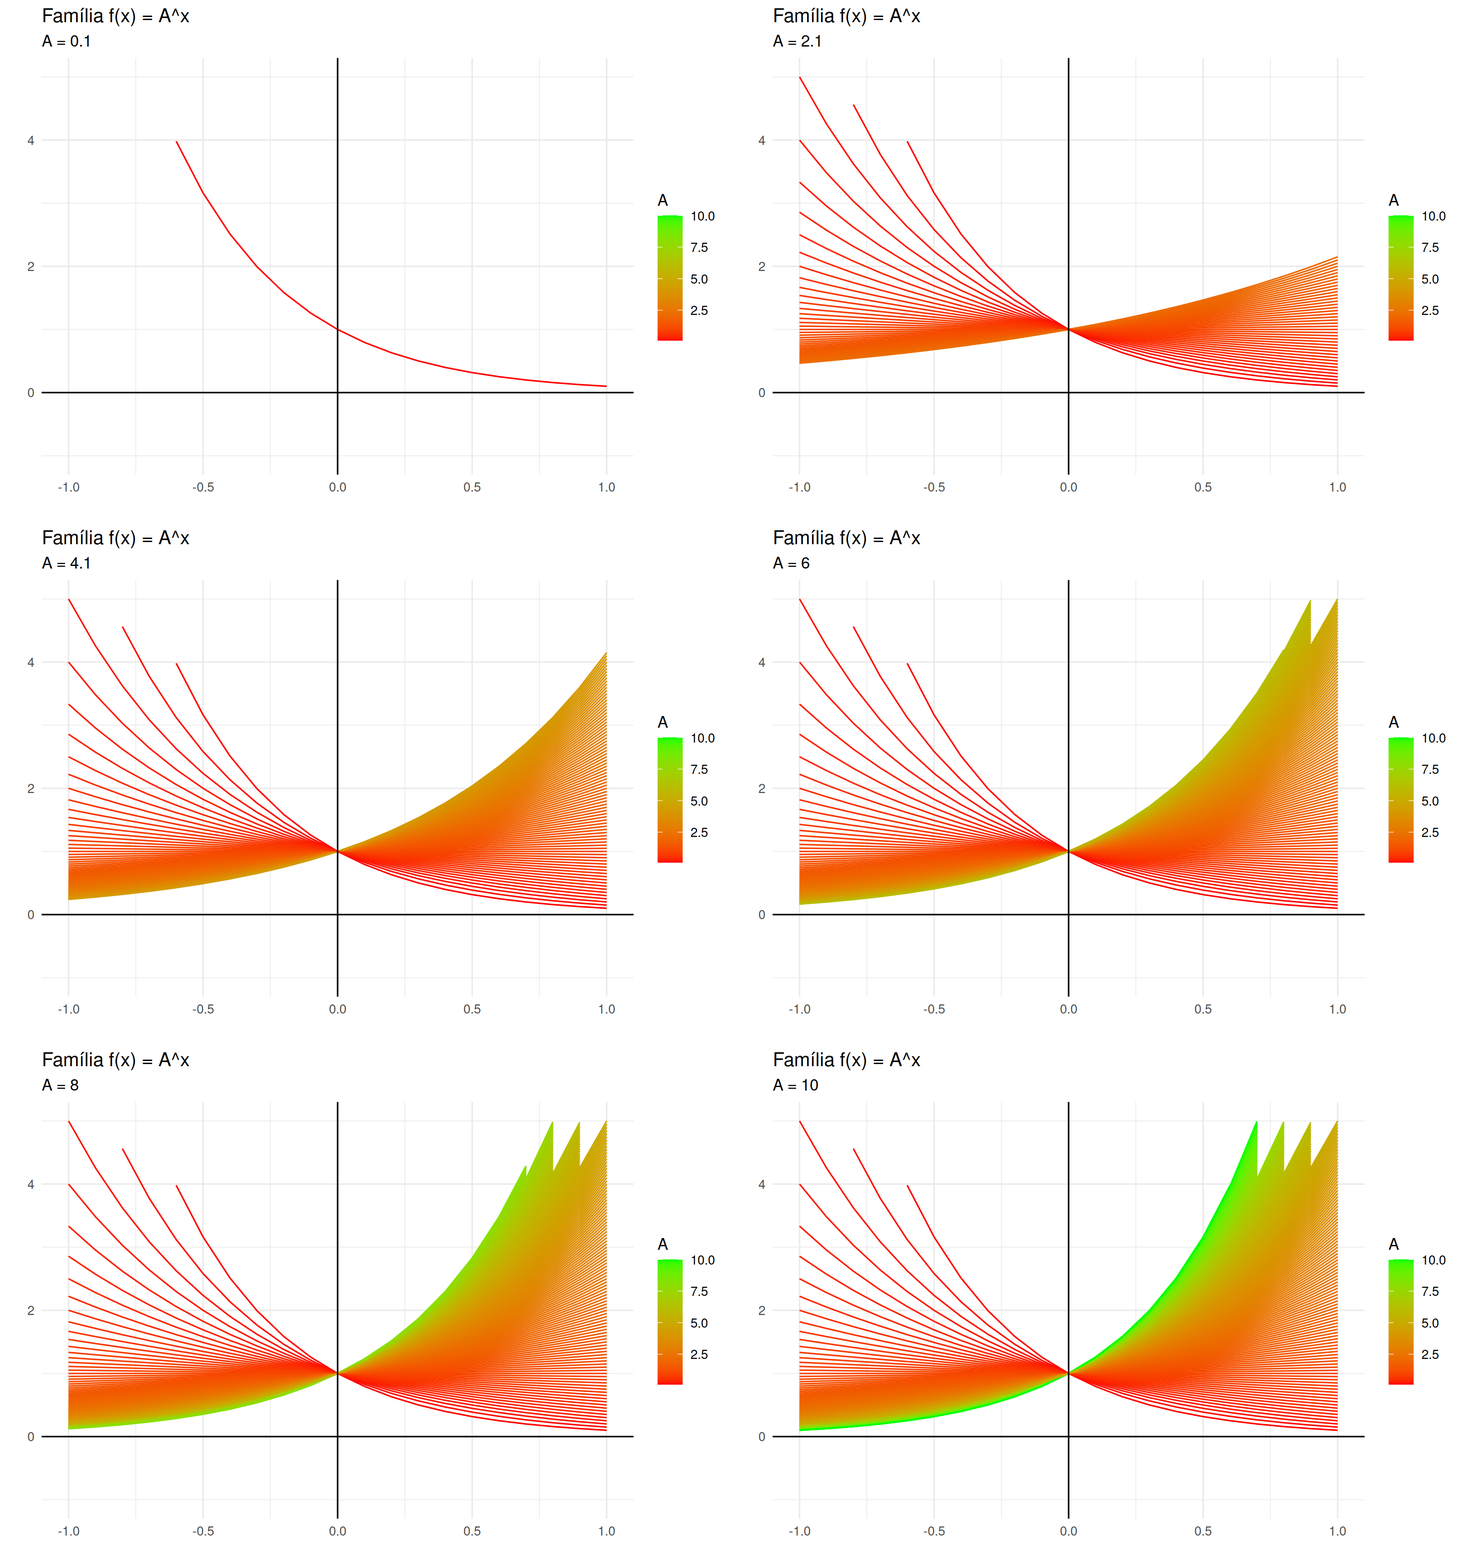
Não queria me alongar muito nem falar de corona então vou só fazer um gráfico bonito mostrando como a função muda a depender de qual \(b\) passamos como base. O exercício é interessante porque explora algumas ferramentas muito úteis do {tidyverse}.
library(tidyverse)
library(gganimate)

expfoo <- function(base) { # uma fábrica de funções

 function(x) { base^x }

}

(sim <- tibble(A = seq(0.1, 10, 0.05)) %>%
  mutate(foo = map(A, ~ expfoo(.x)), # geramos uma lista de funções
         y = map(foo, ~ .x(seq(-1, 1, .1))), # geramos uma lista aplicando as funções
         x = rep(list(seq(-1, 1, .1)), nrow(.))) %>%
  select(A, x, y) %>%
  unnest(c(x,y)))
## # A tibble: 4,179 x 3
## A x y
## <dbl> <dbl> <dbl>
## 1 0.1 -1 10
## 2 0.1 -0.9 7.94
## 3 0.1 -0.8 6.31
## 4 0.1 -0.7 5.01
## 5 0.1 -0.6 3.98
## 6 0.1 -0.5 3.16
## 7 0.1 -0.400 2.51
## 8 0.1 -0.300 2.00
## 9 0.1 -0.200 1.58
## 10 0.1 -0.100 1.26
## # … with 4,169 more rowssim %>%
ggplot(aes(x = x, y = y, color = A, group = A)) +
geom_line() +
geom_vline(xintercept = 0) +
geom_hline(yintercept = 0) +
scale_color_gradient(low = "#d12e2e", high = "#1e6cd9") +
ylim(-1, 6) +
theme_minimal() +
labs(title = "A família exponencial")
animacao <- sim %>%
  ggplot(aes(x = x, y = y, color = A, group = A)) +
  geom_line() +
  geom_vline(xintercept = 0) +
  geom_hline(yintercept = 0) +
  scale_color_gradient(low = "red", high = "green") +
  ylim(-1, 5) +
  theme_minimal() +
  transition_reveal(A) +
  labs(title = "Família f(x) = A^x",
         subtitle = "A = {round(frame_along, 3)}",
         x = "",
         y = "")

animate(animacao)